Â

- Customer: Proplast
- Country: Italy
- Industry: Research & Education
- Solution: Moldex3D Advanced
- View PDF Version
This project was developed by Proplast in cooperation with Engel Italia, Trexel and Onni-stamp.
Executive Summary
Proplast’s goal in this project was to support their customers at every stage of the MuCell® technology implementation. The support went from part design and mold design to MuCell® molding trials and mold piloting. Being that this is a challenging and complex process to approach, Proplast resorted to the aid of Moldex3D solution for MuCell® technology to help engineers navigate through the whole process, optimize part and mold design, and successfully complete the project achieving positive results at the end.
Challenges
The greatest challenge in this case study was to accurately predict MuCell®, and make optimizations accordingly. In this case, four particular areas were identified to further study the effects of MuCell® technology:
- Sink marks
- Warpage
- Cells size prediction and validation
- Cells density prediction and validation
Every step of the process was supported by using the simulation software, Moldex3D.
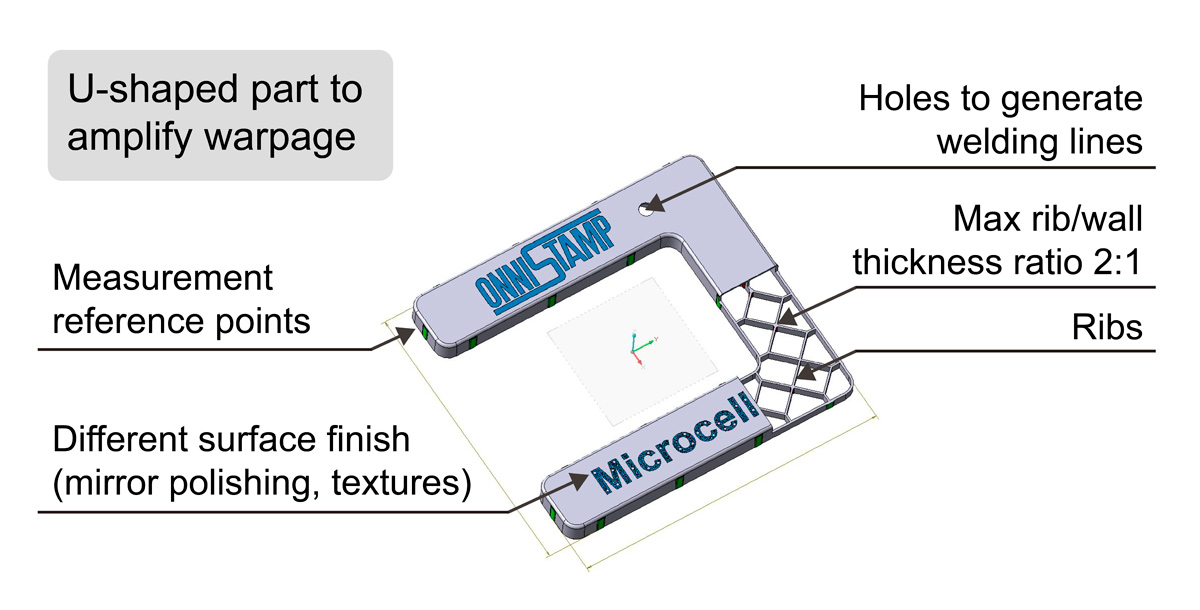 Specific features were added to the part design to further help evaluate, measure, and compare results
Solutions
Moldex3D simulation capabilities offer an opportunity to simulate both conventional molding and MuCell® injection molding. Basing upon software simulations, Proplast was able to compare results of each process and better understand operating differences between the two. Futhermore, Proplast’s goal of conducting an in-depth analysis on the microcelluar molding process, including cell dimension, cell denisty and cell distribution was fulfilled through the use of Moldex3D simulation technology.Â
 Part Design
Benefits
Moldex3D provided an all-around simulation analysis on every aspect of the MuCell® process. With the valuable data from the Moldex3D simulation, Proplast was able to gain insights into the MuCell® process, optimize part and mold design, and most importantly offer constructive recommendations to guide their customers throughout the MuCell® implementation. Moldex3D’s MuCell® simulation includes analysis on:
|
|
Case Study
Virtual MuCell® injection molding is a great help in the whole process to predict MuCell® technology in order to understand the real benefits MuCell® technology can bring. Moldex3D simulation enabled access to the following important aspects of the MuCell® technology:
1. Sink marks:
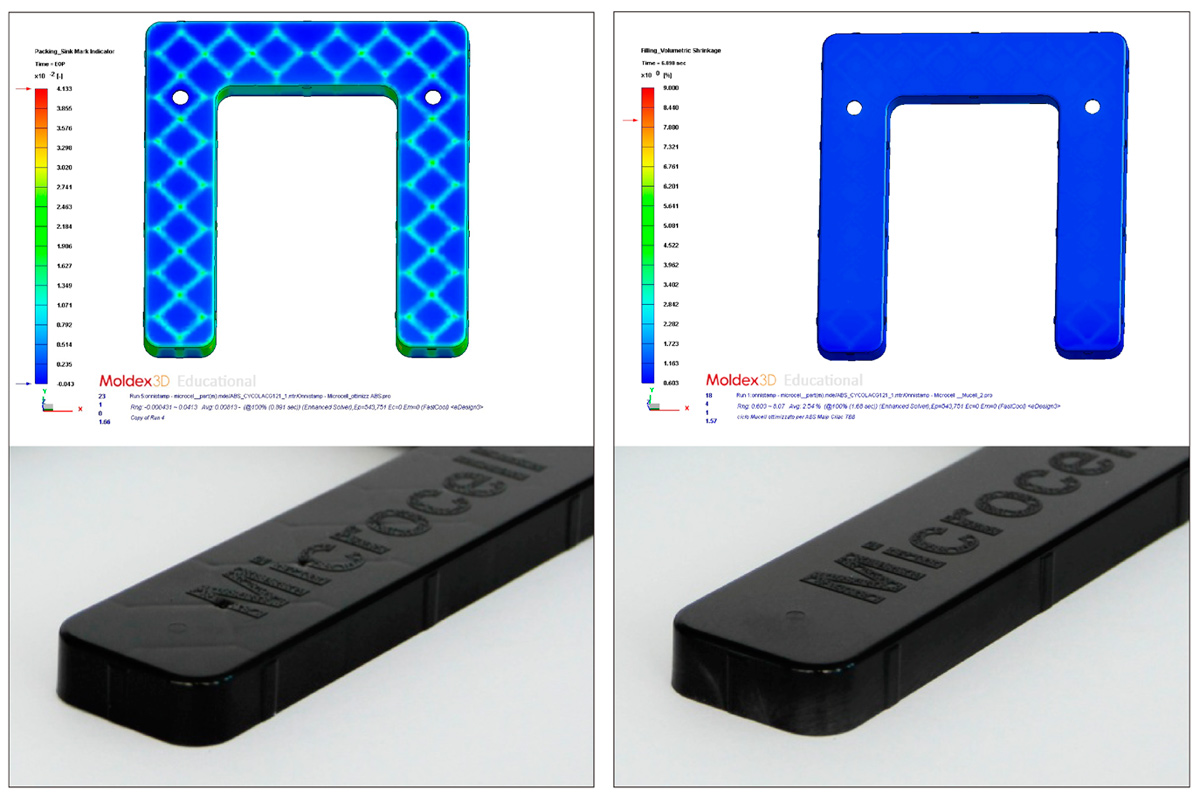 Compact molding (left): Visible sink marks vs. MuCell® (right): No sink marks
The experiemental mold trial results proved that the simulation showed great accuracy of the sink mark prediction on both the compact and MuCell® process. Also, from this example, it demonstrated clearly that the MuCell® technology prevents sink marks very effectively.
2. Warpage:
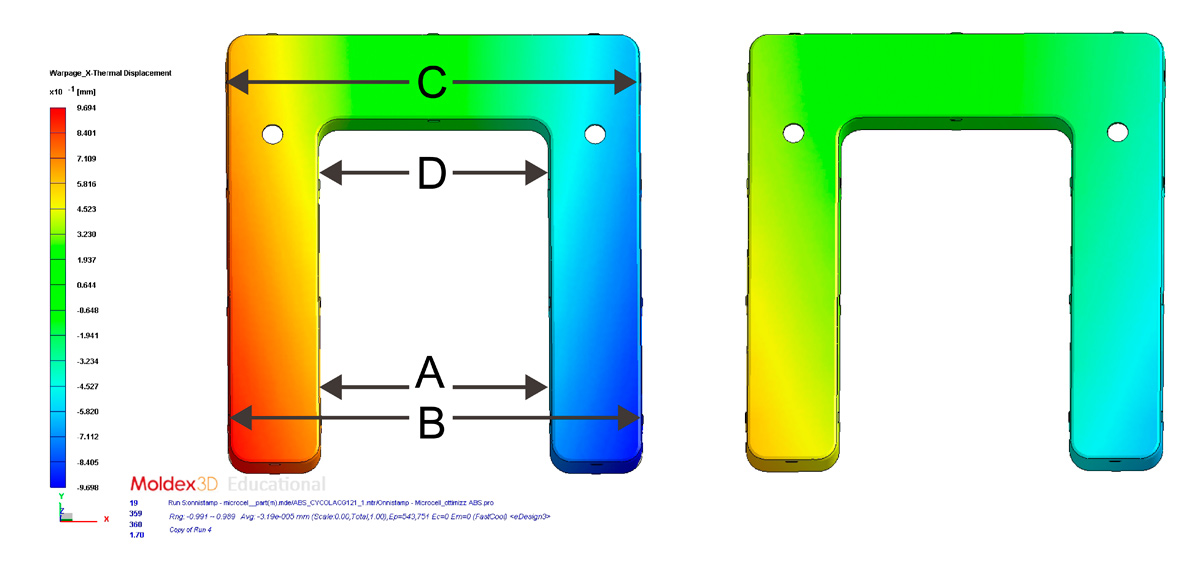 Compact molding (left): Warpage is more severe than MuCell® (right)
Moldex3D successfully predicted the corner effect for both the compact part and the MuCell® part and at the same time helped visualize the improvement on deformation using MuCell® before the part is actually injected.
|  | Nominal | Compact Molding | MuCell® |  Variation (%) | ||
| Simulation | Measurement on real part | Simulation | Measurement on real part | |||
| A | 110 | 108,76 | 109,17 | 109,22 | 109,16 | -0.05 |
| B | 200 | 198,10 | 198,64 | 198,76 | 198,72 | -0.02 |
| C | 200 | 198,61 | 198,92 | 199,18 | 198,86 | -0.29 |
| D | 110 | 109,21 | 109,30 | 109,52 | 109,20 | -0.29 |
Both simulation results and real part measurements showed great improvement on deformation using MuCell®
3. Cells size prediction and validation:
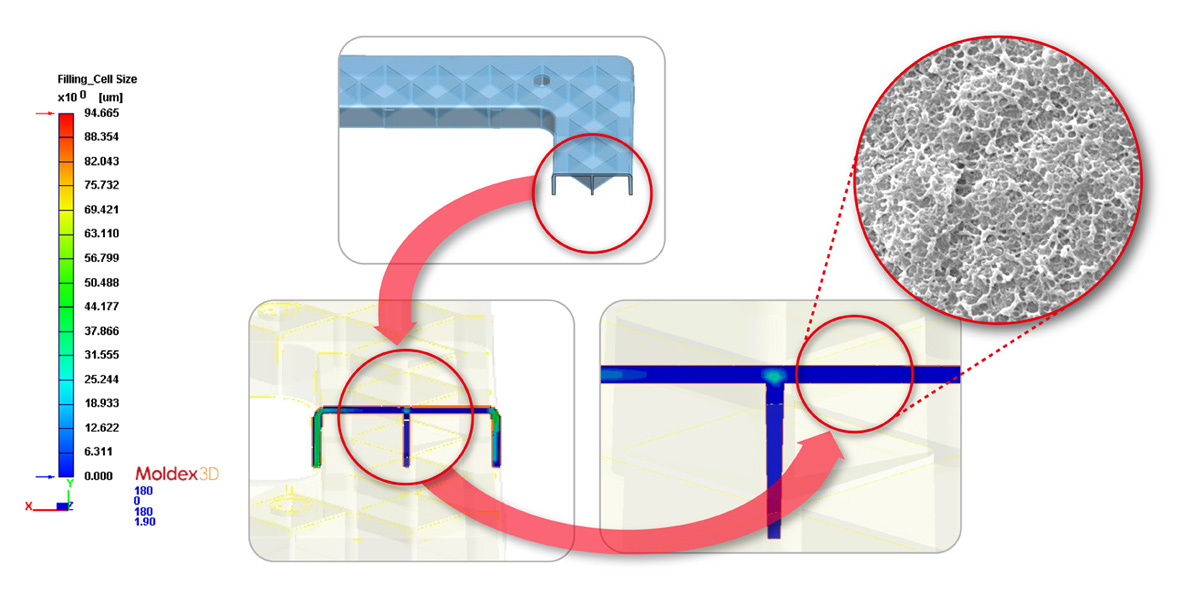
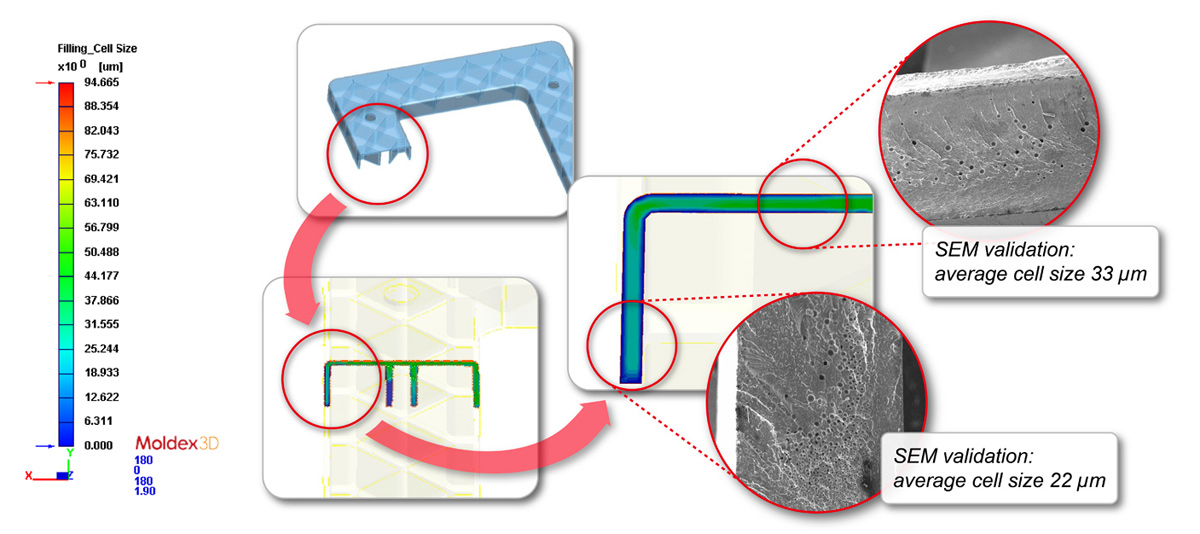
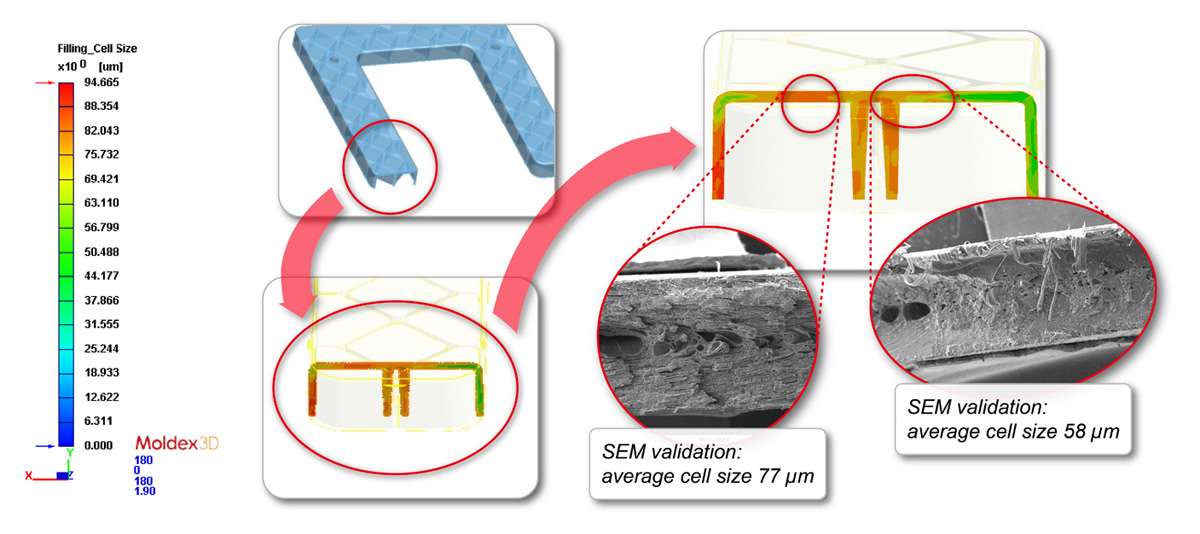
The cell size prediction is crucial for MuCell® process, as the part quality and mechanical strength rely on the uniform cell distribution and adequate cell size. Their correct prediction along the part is essential to make the design correct prior to production. In this case study, the validation focused on three locations (as shown in the following pictures): 1. Gating region, 2. Middle flow region, 3. End of flow region, in order to observe the cell growth along with the flow length, and to validate the reliability of the software on the cell size prediction.
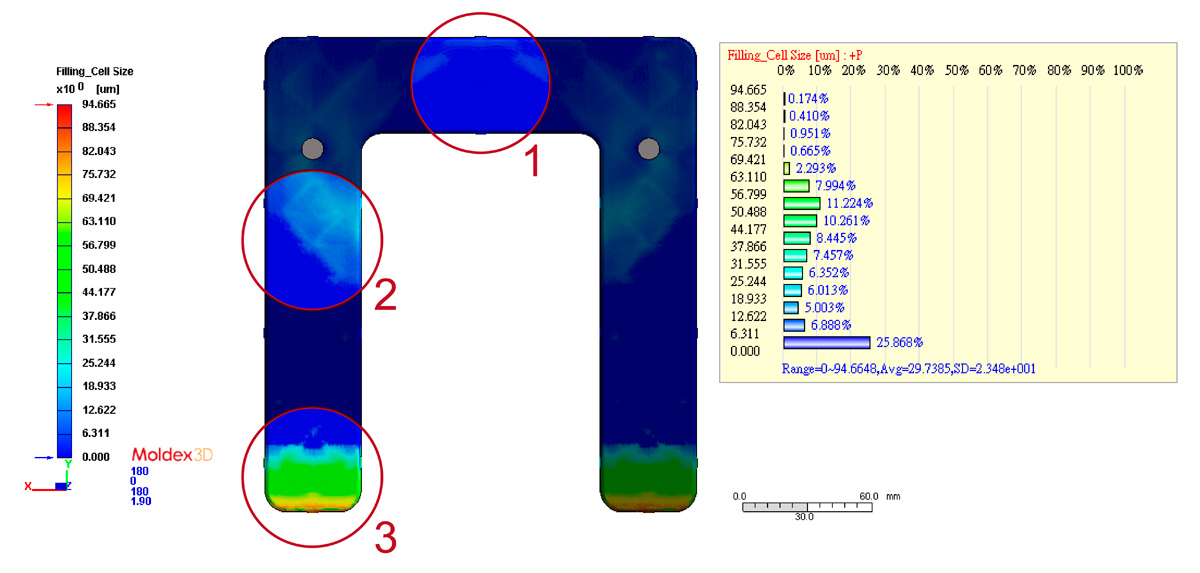
Location 1- Gating region:Â The cells remain small in size due to the high pressure near the gate location. The simulation result provided good prediction of the cell size, validated by the SEM.
Location 2-Middle flow region: The cells grow as they go further from the gate; both simulation and SEM revealed the same trend. The cells on the skin have less time to grow as compared to the core of the part, therefore the size is smaller.
Location 3- End of flow region: At the end of the flow area, the material has travelled the entire path which allows the cell to grow; also, the pressure at the flow front is low and makes no constraints on the growth of the bubbles. It is observed in both simulation and SEM validation, that the large cells are formed. Also, the cell sizes may vary in different parts of this region.
4. Cells density prediction and validation:
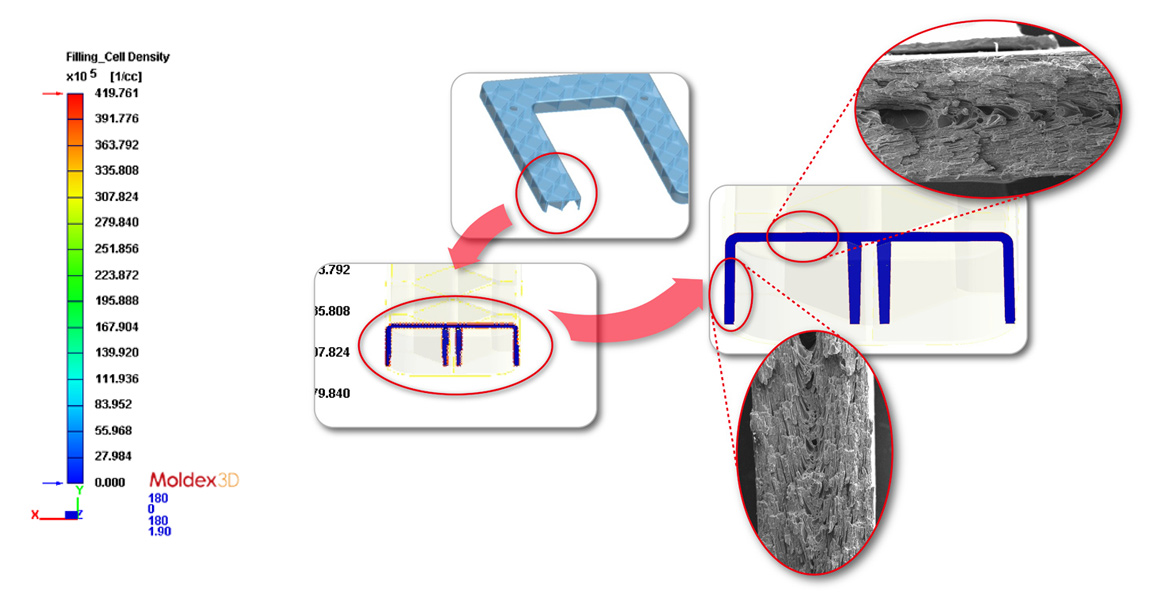
In addition to the cell size, cell density is equally important for MuCell® process. The cell density and cell size are in competition, when the average cell size grows along the flow length, it occupies a bigger area and inevitably the density of the cell drops along the way. Here, the simulation results and SEM are shown for the comparison (as shown in the following pictures).
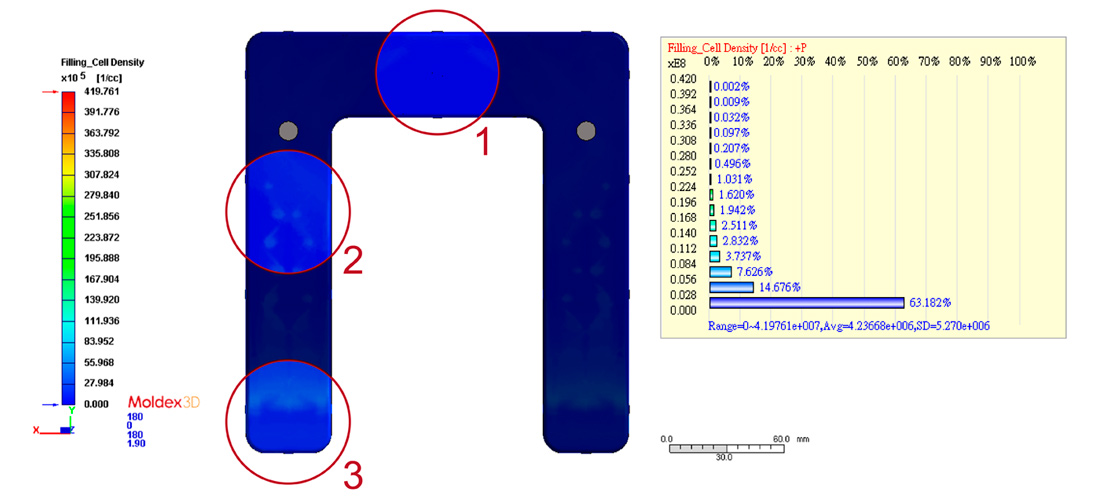
Location 1- Gating region: The density is more difficult to be measured in SEM. By comparing the simulation results and SEM, users are able to understand the relevance between the analysis and the experimental part in density calculation. At the gate area, when the pressure is higher than the saturation pressure, the bubble is not formed. While the bubble starts to grow in this area, the high pressure limits the cell size and allows the formation of each individual bubble (cell nuclearation) without merging them into one big bubble. Here, the simulation and SEM show the same results in this scenario.

Location 2-Middle flow region: As the flow advances down the path, the cells also grow. When they grow bigger, a given space contains fewer cells, resulting in lower cell density.
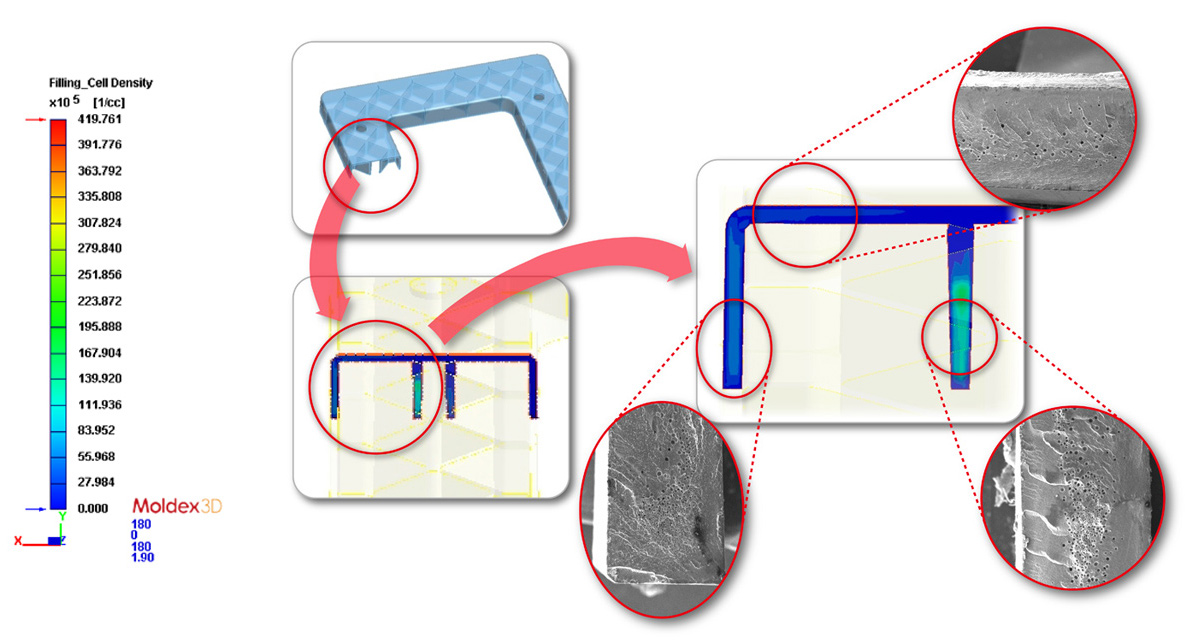
Location 3- End of flow region: At the end of flow area, the bubbles are much developed and merged together, resulting in very low density with only a few cells visualized by SEM.
Results
In summary, through this case study, we could recognize that:
- MuCell® technology is ideal for parts requiring minimized sink mark. Even when the part design is not conventionally optimal (high thickness regions far from gate, high rib/wall ratio), sink marks can be eliminated.
- MuCell® technology is able to significantly improve warpage in general.
- In theory, the improvement on the quality is influenced by the cell growth along the part, which depends on several factors, for example, the flow length and average thickness. In this case study we clearly see the cells growth in regard to this factor.
Most importantly, all these key points mentioned above are able to be precisely simulated and predicted by Moldex3D MuCell® simulation. With the help of Moldex3D, Proplast was capable of fully investiagting the MuCell® process to identify the key benefits, and sucessfully assisted their customers with the implementation of the MuCell® technology to achieve optimal surface quality.
The Value of CAE Simulation
“The methodology of CAE analysis, which was developed and assessed at Proplast, accurately and reliably simulate the MuCell® microcellular injection moulding process, and the quality and morphology of expansion. The flow simulation of MuCell® components performed using Moldex3D provides optimised process parameters and global molding quality (possible weight reduction, volumetric shrinkage, sink marks and warpage) as well as local microstructural description of the cellular structure (size, density and distribution of cells). A good predictive coherence has been observed regarding the here-mentioned study as far as process parameters, MuCell®expansion, weight reduction ability and warpage are concerned,†said Andrea Romeo, CAE Manager at Proplast.
|
|
The flow simulation of MuCell® components performed using Moldex3D provides optimised process parameters and global molding quality as well as local microstructural description of the cellular structure. -Andrea Romeo, CAE Manager at Proplast |
18l Square Paint Tin Cans,5 Gallon Paint Can With Lid,Empty Tin Painting Cans
GUANGDONG DADI WEIYE PACKING INDUSTRIAL CO.,LTD , https://www.ddtin.com
